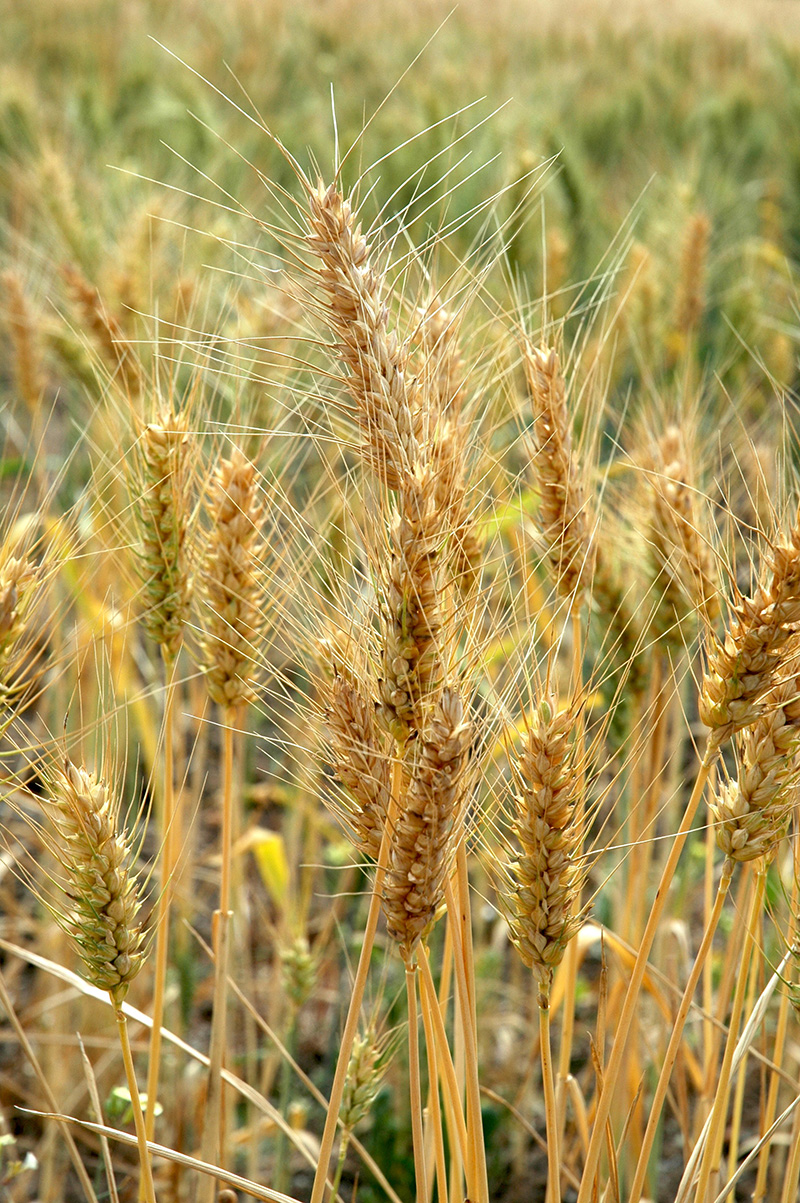
With the end of seeding wrapping up it is fair to say even without sophisticated yield prediction techniques, it just feels like an ideal start to the season, setting up good yield potential. But putting an estimate on the potential yield can assist in many seasonal decisions such as revised inputs, particularly Nitrogen, and grain marketing sales.
How do you estimate yield at the start of the season? We can use both simple and more complex models to do this. Simple models rely on rainfall, when it fell and past yields. The more thorough the model, the more factors will be considered such as time of sowing, soil clasification and nutrition.
Having the available data is the key to choosing which approach to use. Rainfall is the biggest driver of yield. In attempting to predict yield, its important to have an understanding on how efficient the rainfall is being converted into yield (WUE) (which is usually measured as kg/mm effective rainfall).
Figure 1 – WUE using French Schulz Method Planfarm Bankwest Data 2014 Survey

As can be seen in the above graph, there is a range of WUE over the state. There are many interactions that effect WUE; some in the producers control and others outside of their control, but there are still actions that can have an influence on these.
The Wheatbelt NRM eConnected Grainbelt demonstration site, located on the UWA farm in Pingelly, is starting with little of there own data as UWA has only been actively farming Ridgefield since 2015, but are rapidly building up a good database going forward of soil clasification, weather station and soil moisture information.
For this excersise in predicting yield, various sources of data have been utilised (not recommended) to bring together a range of tools to estimate yield.
Past yield result are indicating a 11-12kg/mm effective rainfall (WUE). Early estimates (‘ back of the envelope calculation’) based on this WUE suggest a 3.0-3.5t/ha crop (table 1). But in saying this, during wet years, rainfall is not used as efficiently (water logging effects and higher runoff rates). Applying a WUE of 9kg/mm would suggest yields could be lower at 2.7t/ha. Ipaddock Yield, which similarly uses past yield and rainfall information, is estimating 2.8t utilising average rain for the remainder of the year, suggesting WUE may be lower (figure 2).
Table 1: Estimated yield based on WUE of 9-12 kg/mm and rainfall so far / average rainfall for the remainder of the season.

Figure 2: iPaddockYield estimate for the site for 2016

With these early estimates, does this change any decision making in regards to Nitrogen or grain marketing? These estimates will be reviewed on a regular basis, with an increased confidence as the year progresses, and we will explore how this influences on farm decision making. This is a small component of the eConnected Grainbelt UWA Ridgefield eDemonstration project, with UWA, Planfarm, DAFWA and Wheatbelt NRM collaborating on the project to explore technology on-farm and its use for understanding soils, improving nutrient management and profitability.
Come to our field day on the 15th of June at Ridgefield to see other e-tools that are available, how to interpret weather station and soil moisture probe data and how in-paddock soil analysis can improve your returns.


